

The Environmental Finance Center is pleased to announce the launch of the 2015 Water & Wastewater Rates Dashboard, reflecting the rates that utilities are charging as of January 2015. The dashboard, funded by the Public Water Supply Section of the Division of Water Resources (NCDENR), may be used by utilities during the budget process in the coming months.
New look and new functions!
For everyone who is familiar with the Rates Dashboard, you will notice that we have given it a new look and added many new features and functions:
What is the North Carolina Water & Wastewater Rates Dashboard?
This interactive rates and financial benchmarking dashboard is designed to assist utility managers and local officials with analyzing residential water and wastewater rates against multiple characteristics, including utility finances, system characteristics, customer base socioeconomic conditions, and geography. Financial indicators are added in a separate tab, and a video tutorial is available describing how to use the 2010 dashboard (before the new improvements). Dashboards in previous years have been funded by the Public Water Supply Section of NC DENR or the U.S. EPA.
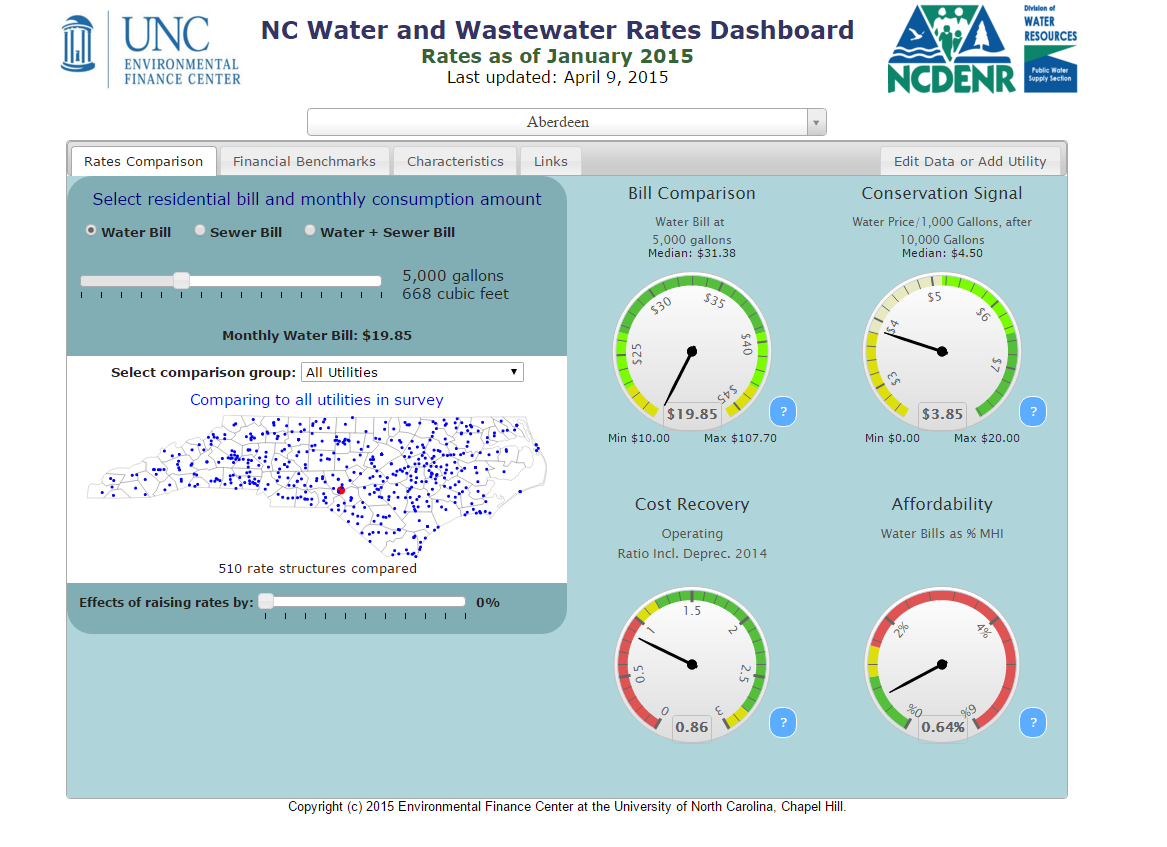
FY2015 (January 2015) residential rates for utilities across North Carolina can be compared with:
You can compare rates for 0 to 15,000 gallons/month at 500 gallon intervals.
You can also raise rates by up to 100% and observe the (hypothetical) effects on the utility's rates, revenues and rate affordability.
The following measures for the selected utility are compared to key indicators or to the utilities within the selected comparison group:
In the Financial Benchmarks tab, 8 financial performance indicators are displayed for your utility, calculated from data reported on your utility's audited financial statements and provided to the Local Government Commission. The indicators include:
Track how your bills compare to others at the low, average and high end of residential consumption.
Video Tutorial: Using the Indicators and Understanding What they Tell You About Your Utility's Rates and Financial Performance (using the 2010 version of the dashboard)
View a video tutorial using the 2010 version
Project page: North Carolina Water and Wastewater Rates, Rate Structures and Connection Fees
Project page: Utility Financial Sustainability and Rates Dashboards
Project page: North Carolina Water System Capacity Development Support
Project page: Smart Management for Small Water Systems