

ncIMPACT
Policy Research
Faculty and staff at the School of Government work with state and local government officials on a wide range of projects. See below for excerpts from research products prepared by public policy staff, often in collaboration with personnel from the School, UNC, and other organizations. Most of the headings are clickable hyperlinks that will take you to the full version of each product.
North Carolina Pre-K Program Fact Sheet (Sep 2017)
"NC Pre-K is a primarily state-funded pre-kindergarten program administered by the Division of Child Development and Early Education within the North Carolina Department of Health and Human Services. The program educates eligible four-year-olds in classrooms located in a variety of settings, including public schools, Head Start sites, 1 and private child care centers (both forprofit and nonprofit). To be eligible, a child must have turned four on or before August 31 of the program year and be from a family whose gross income is at or below 75 percent of the state median income. However, children of certain military families are also eligible without regard to income, and up to 20 percent of age-eligible children enrolled may have family incomes in excess of the income cap if they have documented risk factors in specific categories including developmental disability, limited English proficiency, educational need, or chronic health condition."
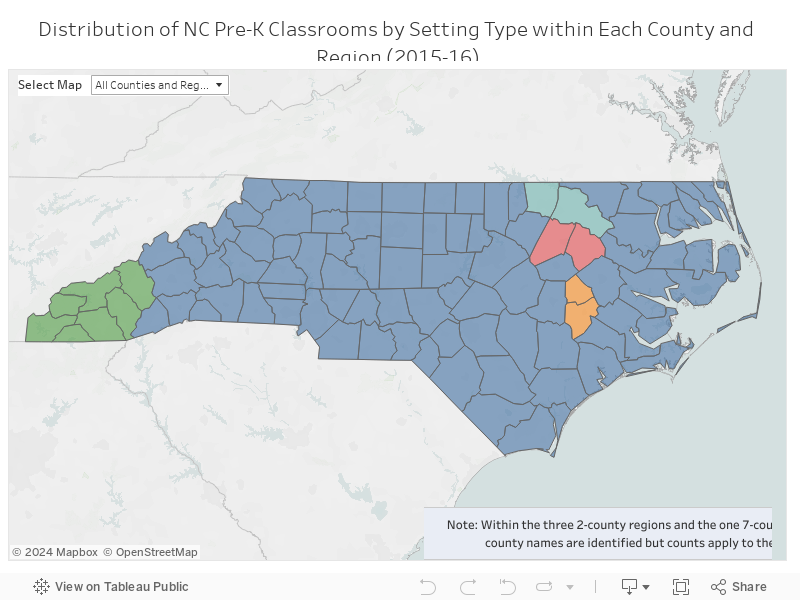
Interactive Maps Showing How the NC Pre-K Program Is Delivered in Each County (May 2017)
NC Pre-K is a state-funded program administered by the Division of Child Development and Early Education within the North Carolina Department of Health and Human Services. The program serves eligible four-year-olds in classroom-based educational programs in a variety of settings, including public schools, private child care centers (both for-profit and nonprofit), and Head Start sites (in both public and private facilities). These five types of pre-K settings are explored in more detail in the maps below, which give an overview of the settings used to deliver pre-K in each county and show, for each type of setting, the counties that rely upon it relatively more or less.
Source: Adapted from Peisner-Feinberg, E. S., Mokrova, I. L., & Anderson, T. L. (2017). Effects of Participation in the North Carolina Pre-Kindergarten Program at the End of Kindergarten: 2015-2016 Statewide Evaluation. Chapel Hill, NC: The University of North Carolina, FPG Child Development Institute. We are grateful to Dr. Peisner-Feinberg for securing permission from the North Carolina Division of Child Development and Early Education for us to analyze the classroom-level data she summarized in Table 17 of her report.
A Process Evaluation and Demographic Analysis of Jury Pool Formation in North Carolina's Judicial District 15B (Sep 2016)
"Our evaluation includes documenting the individual steps in each of the three main parts of the process for forming jury pools: (1) the development and distribution of lists of jury-eligible individuals by the state to individual counties, (2) the cleaning and preparation of the lists at the county level, and (3) the related county-level jury pool–selection and summons process. After discussion of the statewide process, our evaluation focuses exclusively on the county-level process used in Chatham and Orange counties."
"Individuals who identified as Hispanic or Latino were slightly overrepresented in Chatham’s survey results and slightly underrepresented in Orange’s results. However, the percentages were fairly close to the corresponding Census Bureau estimates for voting-age Hispanic or Latino citizens, and those citizens’ relatively small share of each county’s population meant that the overall effect was slim. For example, the underrepresentation in Orange County amounted to about five fewer potential jurors out of almost 750 surveyed... The median reported household income among Chatham County respondents was $64,500 per year, while it was $90,000 per year among Orange County respondents. In Chatham, respondents with household incomes of at least $100,000 outnumbered respondents with incomes less than $25,000 by a ratio of two to one; in Orange, that ratio was almost eight to one."


Trial Judges' Perceptions of North Carolina's Office of Indigent Defense Services: A Report on Survey Results (Mar 2016)
"We asked the 80 judges who responded “Yes” to the question to describe the impact of the rate reductions on the quality of indigent representation they had observed; of all the open-ended questions in our survey, this one received the most responses. Fifty-nine of the 66 responding judges indicated that the quality of representation had suffered. Forty-four of these respondents attributed this to better, more experienced attorneys removing their names from the appointment lists, leaving more indigent defendants and respondents to be represented by less experienced—and, in some cases, less competent—attorneys."
"Two of the most striking survey results were (1) the 80 of 119 judges who observed an impact on the quality of representation provided by assigned counsel that they attribute to the 2011 reduction in rates paid to such counsel and (2) the 59 of 66 judges who indicated in a follow-up question that the quality of indigent representation had suffered as a result. In their comments, judges raised concerns about experience, availability, and preparation. In other words, they associated the rate reductions with several of the key concerns they had described in response to earlier questions about their satisfaction with IDS administration of indigent defense. This further indicates that decisions related to PAC compensation rates can affect the overall quality of indigent representation."


North Carolina Public School Kitchen Capacity Study (Jul 2015)
"The most common types of cooking equipment identified by respondents with on-site commercial kitchens were convection ovens (94 percent), steamers (84 percent), and tilting braisers (69 percent). Fewer respondents identified combi-ovens (31 percent), range tops (24 percent), stoves (20 percent), and fryers (16 percent). Convection ovens together with steamers were being used by 81 percent of the respondents (537 schools)."
"The overwhelming majority of school staff said they would use products like leafy greens, sweet potatoes, and apples in their kitchens (and some already do). Still, several barriers prevent broader access to fresh produce in public schools. First, some schools do not have the type of equipment shown to be associated with greater use of leafy greens and sweet potatoes. Specifically, combi-ovens—which are strongly associated with the use of fresh greens—are present in only 31 percent of the schools surveyed. Second, preparation of fresh produce can be more time-consuming than some less healthy alternatives, and existing staff hours are not always sufficient. Finally, a small percentage of staff seems unaware that Farm to School produce is available to them and appropriate for their cafeteria menus."


Evaluation of the North Carolina Super Summer Meals Pilot (Jul 2013)
"The results of the 2012 program are impressive. From 2011 to 2012, the number of summer lunchtime meals served increased by 159 percent in the pilot LEAs (109,169 additional lunches served). The number of meal sites in those LEAs grew by nearly 67 percent (seventy-five new sites). Moreover, the eleven pilot LEAs drew down almost $592,000 in federal funds for the meals program in 2012. Statewide—including non-pilot participants—the number of summer lunchtime meals served grew by nearly 18 percent (345,749 additional meals)."
"The SOG team conducted in-depth, sixty- to ninety-minute, semi-structured post-program interviews with each of the eleven pilot LEA sponsors and with each mini-grant recipient (the aforementioned pilots, two regional food banks, Charlotte-Mecklenburg Schools, and the nonprofit Kicking4Hunger). The team then held semi-structured interviews with thirteen site supervisors from the pilot LEAs, DHHS consultants and staff, local and national SOS staff, and others directly involved with this effort. We also conducted follow-up interviews with sixteen former SFSP sponsors who declined to participate in the SFSP in 2012 to explore the reasons for their refusals. In total, we spoke with fifty-one individuals associated in various ways with the summer meal programs."
