

Changes in North Carolina Jail Populations During the COVID-19 Pandemic
We previously shared data on jail occupancy in North Carolina for 2018 (here) and 2019 (here). Responding to requests for information regarding changes in jail populations during the COVID-19 pandemic, with this report we offer information about 2020 jail populations. For an explanation regarding our data source and explanatory notes, please see our prior reports. Before we get to the numbers, we make two important points. First, beginning on April 6, 2020, a moratorium was placed on most inmate transfers from county jails to the state prison system.[1] As our colleague Jamie Markham explained, state officials imposed that moratorium to help manage the COVID-19 pandemic. As a result, inmates ordered to serve active time were—unless sentenced to time served, released on appeal bond, or otherwise permitted to delay the start of their sentence—rolled into a “jail backlog.”[2] By the end of May 2020, there were over 1600 backlog inmates in county jails.[3] To the extent efforts were made to reduce populations in county jails, the moratorium would have impacted those initiatives. Second, the COVID-19 pandemic has resulted in a suspension of jury trials. Charging new offenses, however, has continued. Thus, jails may be experiencing a backlog of defendants detained pretrial.
Statewide Occupancy Rates
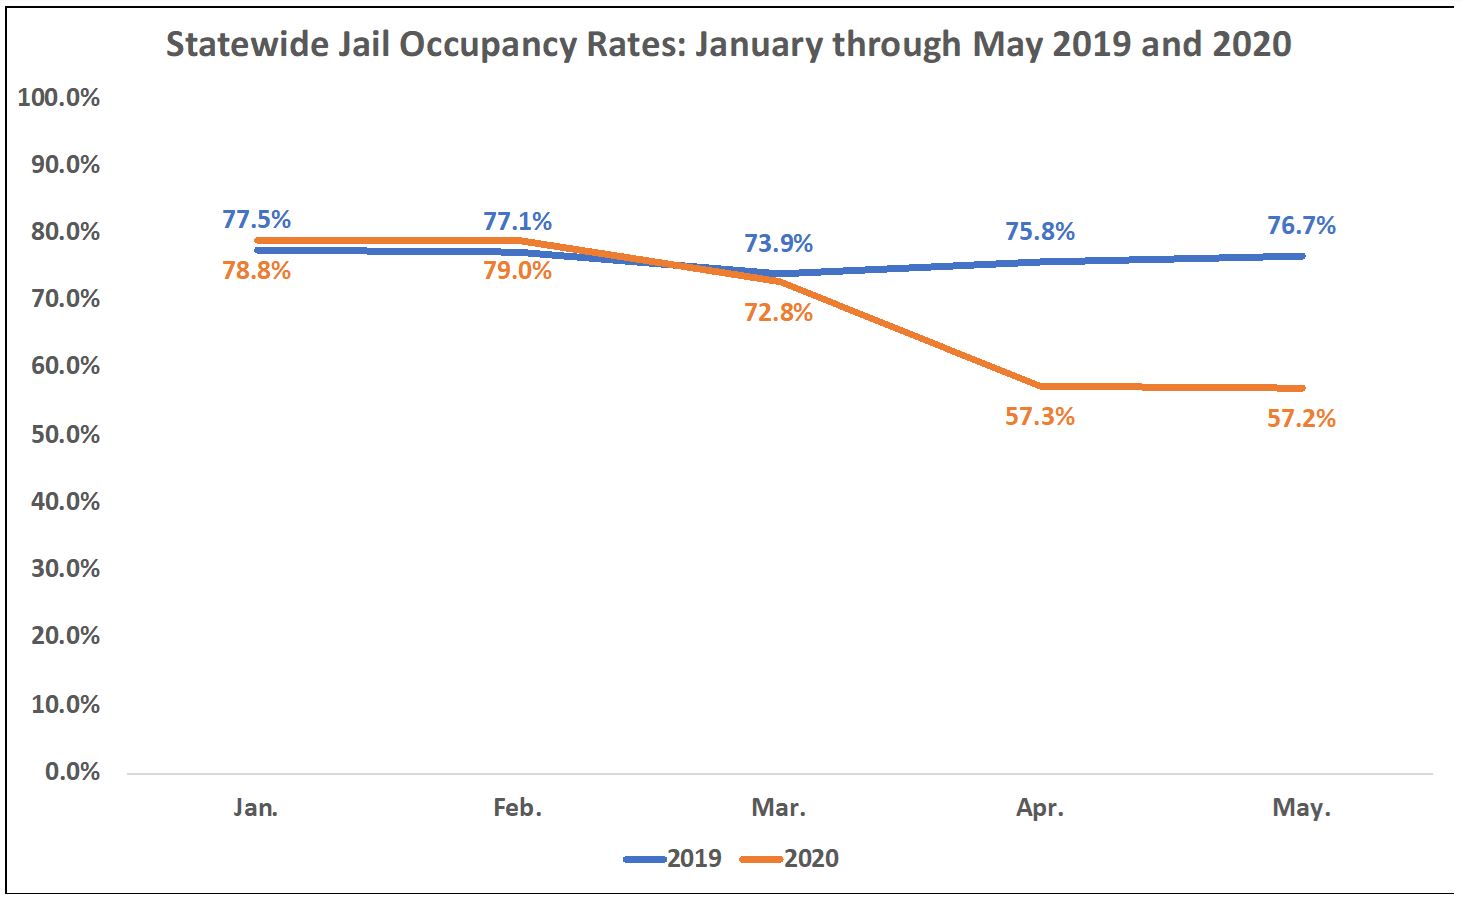 Statewide, the jail occupancy rate for the first five months of 2020 was 7.1 percentage points (9.3%) lower than the occupancy rate in 2019 (69.2% vs. 76.3%). As used here, occupancy rate refers number of individuals held in jail divided by reported jail capacity. However, as compared to the same months in 2019, 2020 jail occupancy rates did not dip significantly until April and May (see graph, this page). The statewide occupancy rate in March 2020 was only 1.1 percentage points lower than the same month in 2019. However, April 2020 saw an 18.5 percentage point decrease from April 2019 (57.3% vs. 75.8%), and that trend continued in May 2020, when the occupancy rate was 19.5 percentage points lower than the rate in May 2019 (57.2% vs. 76.7%).
County-Level Occupancy Rates
As we have found with other criminal justice metrics, statewide rates disguise considerable variation at the county level. Among the 87 counties included for analysis,[4] 24 counties experienced an increase in jail occupancy for the first five months of 2020 as compared to the same period in 2019. Those increases ranged from an increase of .03 percentage points in Wake County to an increase of 45 percentage points in Graham County. Table 1 below shows all counties that experienced an increase in jail occupancy in this period. Sixty-three counties experienced a decrease in jail occupancy rates in the first five months of 2020, compared to the same period in 2019. Decreases ranged from a decrease of 0.04 percentage points in Lee County to a decrease of 53.2 percentage points in Iredell County. Table 2 below shows all counties that experienced decreases in jail occupancy rates.
Table 1. Counties with Increases in Jail Occupancy Rates, January through May 2020, As Compared to the Same Period in 2019
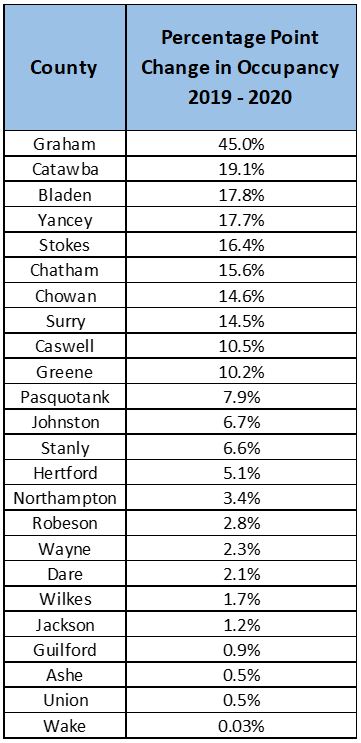
Table 2. Counties with Decreases in Jail Occupancy Rates, January through May 2020, As Compared to the Same Period in 2019

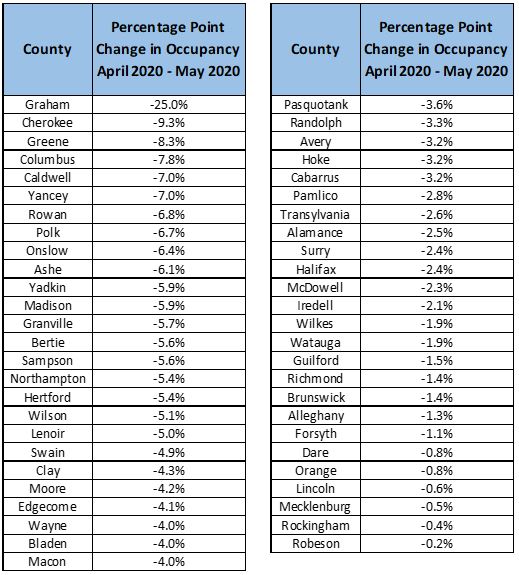
Examining trends in 2020, and focusing on the months of April and May, where significant decreases in occupancy rates were experienced at the state level, 30 counties shown in Table 3 below saw an increase in occupancy rates from April 2020 to May 2020. Percentage point increases ranged from 27.7 in Franklin County to 0.1 in Durham County. For the same period, 51 counties, shown in Table 4 below, experienced decreases in occupancy rates. Percentage point decreases ranged from 25 Graham to 0.2 in Robeson.
Table 3. Counties Experiencing Increases in Jail Occupancy Rates, April to May 2020
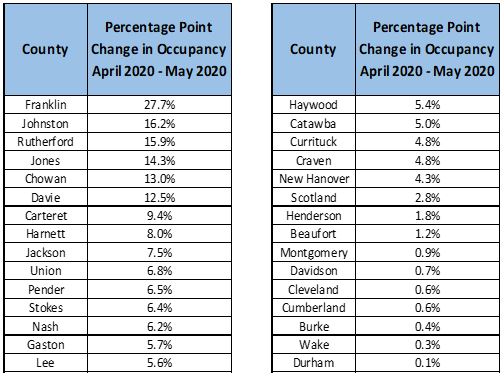
Table 4. Counties Experiencing Decreases in Jail Occupancy Rates, April to May 2020
A spreadsheet showing our county-level data is available here. That spreadsheet includes occupancy rates and headcounts.
We will continue reporting on jail populations throughout 2020. Please contact us if you have any questions regarding the data or input for how we might better understand the COVID-19 response in the context of jail populations.
[1] Jamie Markham, Two-Week Moratorium on Inmate Transfers to Prison, UNC Sch. of Gov’t: N.C. Crim. L. Blog (April 7 2020), https://nccriminallaw.sog.unc.edu/two-week-moratorium-on-inmate-transfers-to-prison/.
[2] Id.
[3] Jamie Markham, An Update on Prisons and Jails as the Courts Extend Operations, UNC Sch. of Gov’t: N.C. Crim. L. Blog, (June 3, 2020), https://nccriminallaw.sog.unc.edu/an-update-on-prisons-and-jails-as-the-courts-expand-operations/.
[4] As detailed in our accompanying spreadsheet, some counties do not have facilities accepting occupants, and some facilities did not report data in 2019 or in the early months of 2020.
Ross Hatton, Graduate Research Assistant, coauthored this post.
The post Changes in North Carolina Jail Populations During the COVID-19 Pandemic appeared first on North Carolina Criminal Law.
Faculty Coordinators